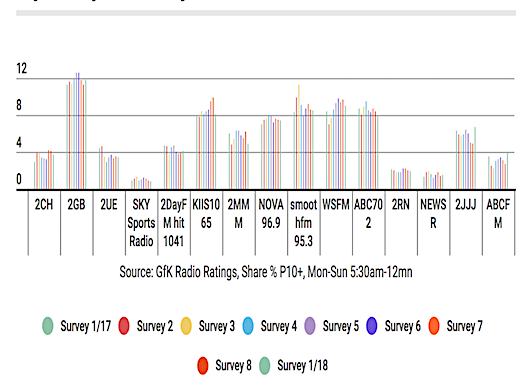
Our trend charts now show survey data from 2017, plus today’s first survey of 2018.
Below you will see the graphs for each city. View the raw results here.
If you mouse over the bars you can see the result for each station by survey, and you can play around with the interactive graphics in other ways as well, such as mousing over the coloured dots at the bottom of the chart to see a specific survey.
Sydney
Melbourne
Brisbane
Adelaide
Perth